Clinical Trial Risk Detection & Research Analytics Solutions
Utilize AI-powered centralized statistical monitoring to help researchers uncover insights commonly missed by traditional data quality control methods. Ensure focused and productive data analysis on the most pertinent data points. With CluePoints’ advanced analytics, you can navigate clinical trials with greater efficiency and confidence.
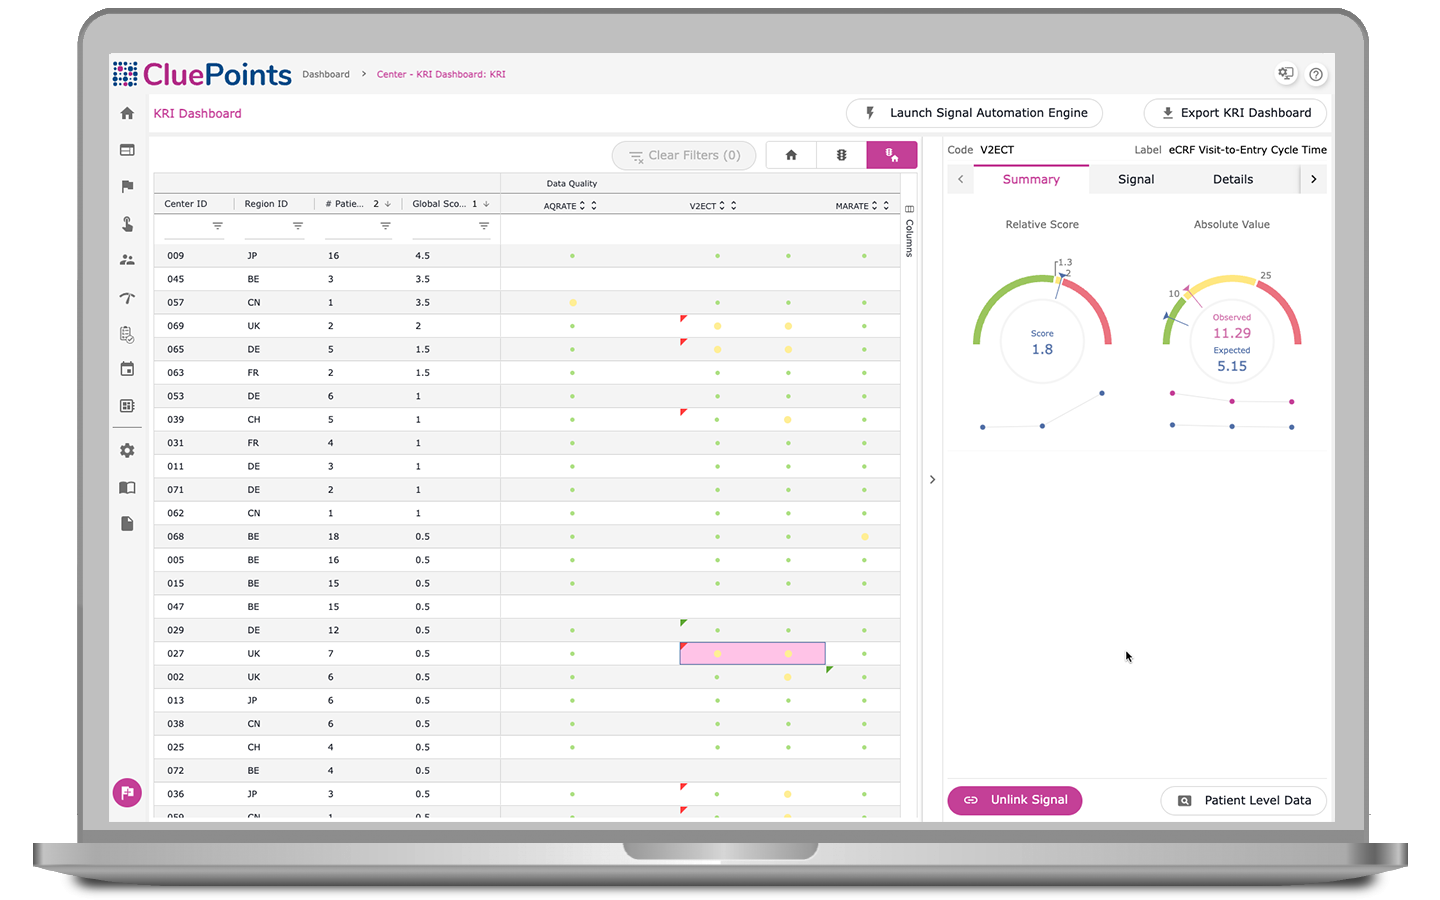
By harnessing statistical algorithms and subjective thresholds, our KRI dashboard ranks research sites based on performance metrics, spotlighting ‘at-risk’ clinical locations. Users can select from pre-defined KRIs or adapt indicators to clinical trial data, which yields scores that benchmark research site performance against peers and quality tolerance limits, pinpointing causation and ensuring proactive corrective actions through an integrated issue-tracking management system.
Measure non-serious adverse events per patient visit for safety monitoring
Track serious adverse events per patient visit for safety assessment
Indicate missed patient assessments compared to expected
Monitor deviations from study protocol per patient visit for adherence
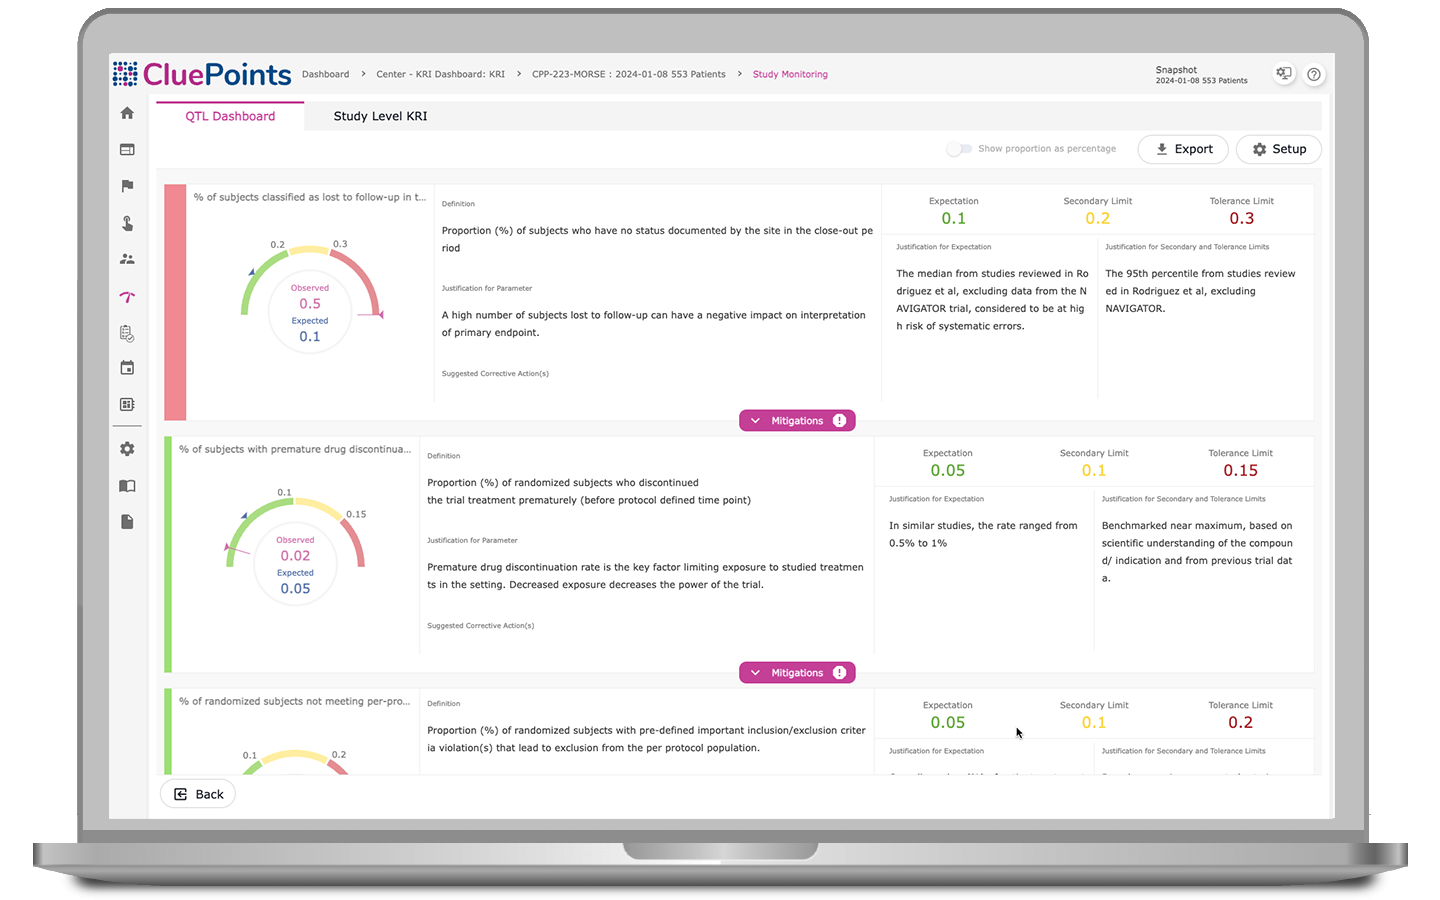
Our QTL module automatically identifies systematic issues, monitors key metrics, and documents deviations from pre-defined QTLs. Our platform automatically uncovers threats to trial validity and patient safety, enabling early issue detection for prompt corrective action. With comprehensive documentation of QTLs and breaches, including justification and evidence, all in one accessible platform, teams can ensure accountability and compliance throughout the clinical trial process.
Monitor the rate of patients discontinuing study drug treatment prematurely
Monitor the rate of enrolled patients lost to follow-up
Monitor the rate of patients terminating participation before reaching an endpoint milestone
Central Statistical Monitoring enables users to test all collected clinical research data, including both clinical and operational, spotlighting patients, sites, and countries exhibiting atypical data patterns and uncovering operational challenges that may otherwise remain hidden. Central Statistical Monitoring lets you review trends in results, delve into underlying data, and manage findings within a unified issue management environment.
Identify any instances of fraudulent activity or inaccuracies associated with patient information
Identify errors in data recording, including improper rounding or digit manipulation
Identify widespread errors stemming from equipment malfunctions or other systemic issues
Identify any biases or deficiencies in the training of raters or assessors
Identify data timeliness issues, such as implausible data accrual rates
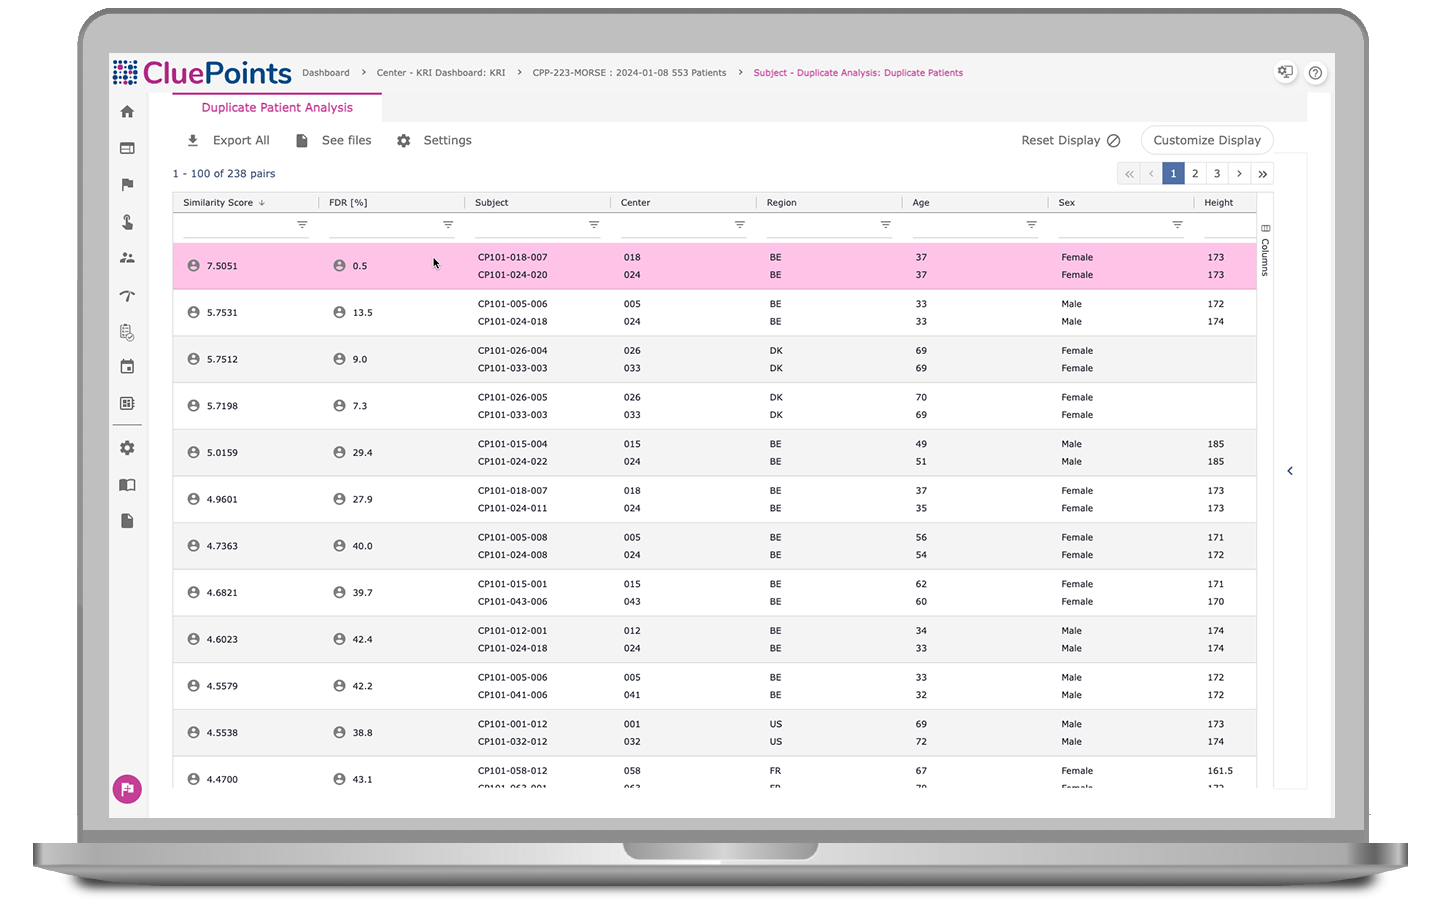
Our platform preemptively identifies professional patients within trials to prevent enrollment abuse. Duplicate Patients generates a priority listing of patient pairs by specifying configurable variables—such as age, sex, height, weight, country, and race—likely to indicate duplicates. Users can review automated results within a convenient interface, prioritizing based on similarity scores and comparing side-by-side records for quick evaluation.
Address challenges posed by clinical site proximity, particularly in regions like North America where states such as California, Florida, Pennsylvania, and New York serve as hubs for research sites
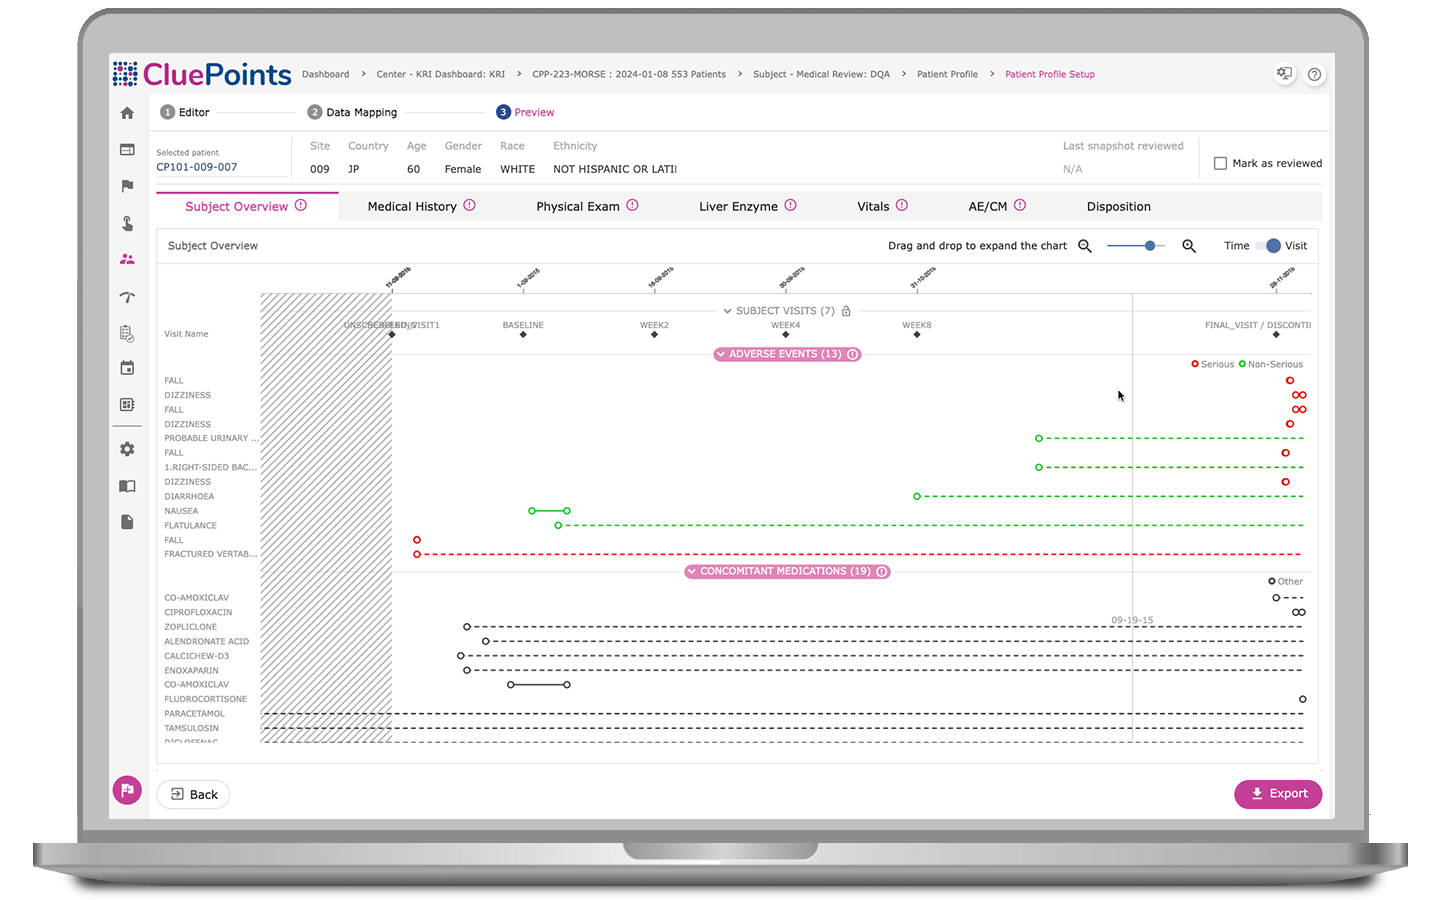
The seamless integration of Central Statistical Monitoring with our Patient Profiles module enables clinical teams to identify atypical patient patterns and prioritize investigations into anomalies within data sets, ranking patients based on their degree of atypicality. Users can gain detailed insights into patient experiences and leverage user-friendly data visualizations to target those of utmost importance.
Characterize risk signals quickly and effectively, enabling centralized medical and safety reviews
Assess chronological views of patients’ visits, investigational product exposure, adverse events, concomitant medications, and other pertinent patient information
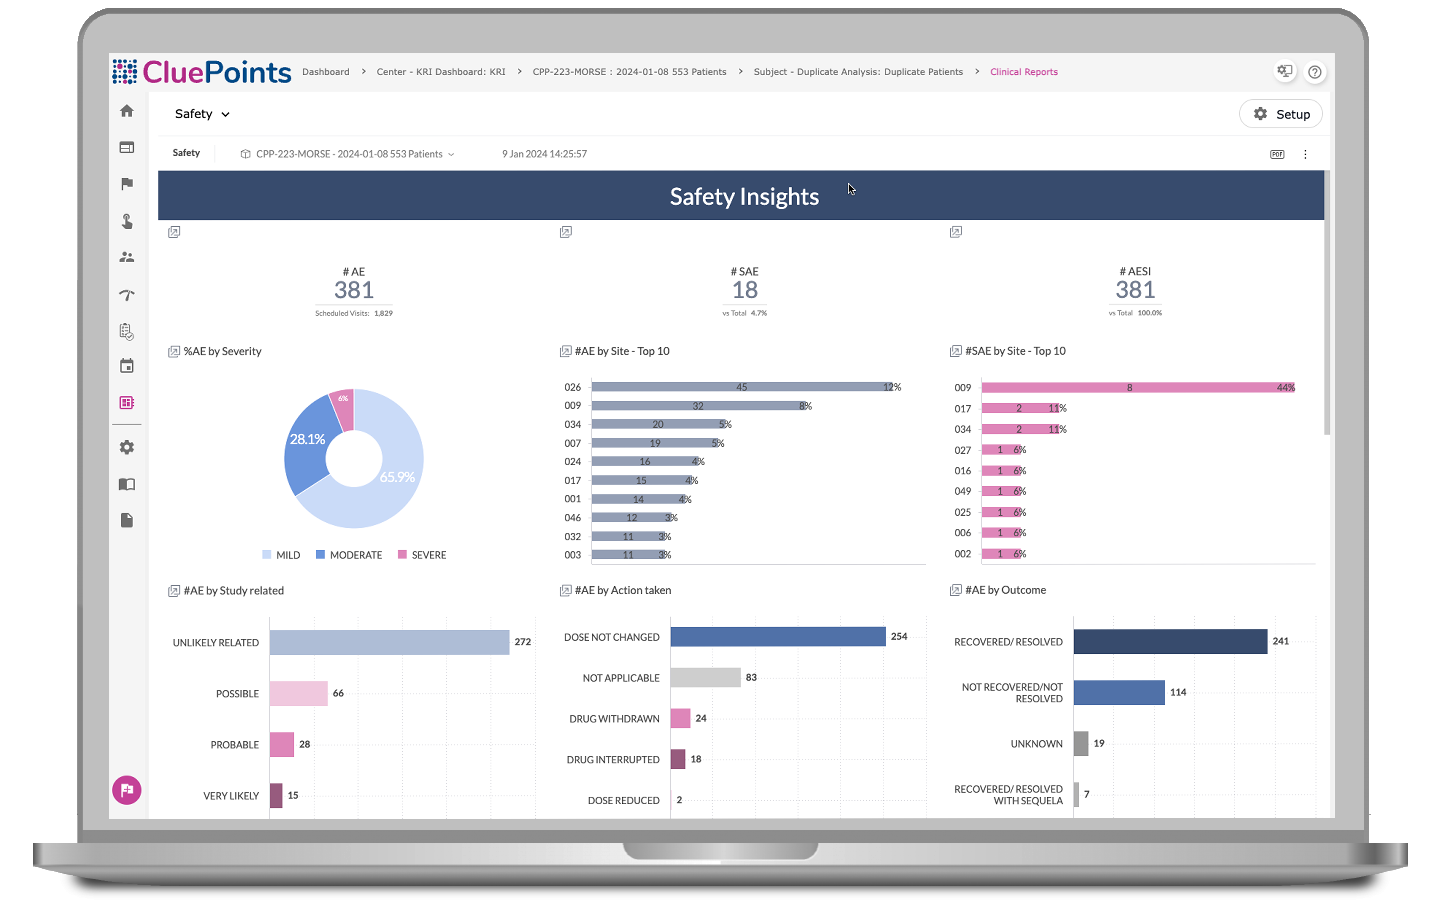
BEYOND is an advanced data visualization solution that goes beyond traditional statistical analysis, enabling users to explore clinical and operational data from various perspectives and in customizable formats. With multiple data widgets and combined data from different domains, users can summarize and aggregate data effectively and focus on specific aspects of trial operations, facilitating the identification of emerging risks and operational challenges.
Focus on safety-related data, allowing for top-down analysis of adverse event distribution
Examine outliers, identify associated adverse events and medications, and make comparisons over time
Integrate forecast data for further insights into predicted versus actual enrollment and screen failure rates
Extend the view to compute averages across sites for a thorough assessment of operational metrics