

Risk-Based Monitoring (RBM) is the future of clinical trials. Yet, despite significant progress in recent years, many practical challenges remain in making it fully effective.
That’s why CluePoints is introducing a new, data-driven dashboard designed to help Sponsors and CROs benchmark projects—not only across protocols and portfolios, but also against industry standards through the CluePoints community.
In this feature, Francois Torche, CEO, and Sylviane de Viron, Senior Research Data Analyst, share their insights from developing the tool and explain how it can help establish an industry gold standard for Risk-Based Quality Management (RBQM) and centralized monitoring.
Table of Contents
- Understanding the Evolution of Risk-Based Monitoring (RBM)
- From ICH E6(R2) to E6(R3): How Guidelines Shaped RBQM
- COVID-19 & the Acceleration of Centralized Monitoring
- Why a Proactive Approach to Risk Mitigation Matters
- How Metadata Unlocks the Future of RBQM
- Trends in KRIs by Study Phase & Therapeutic Area
- Informing the Future of RBQM Standards
- Creating a Holistic View of Risk Across Therapeutic Areas
- Shaping the Future of Clinical Trial Quality
Understanding the Evolution of Risk-Based Monitoring (RBM)
From ICH E6(R2) to E6(R3): How Guidelines Shaped RBQM
Since the ICH E6 (R2) guidelines of 2016 highlighted the potential of RBQM to make clinical trials more efficient and improve operational success, adoption has been steadily rising. Implementation has accelerated greatly over the years. And the introduction of E6(R3) in 2025 placed even greater emphasis on flexibility, proportionality, and critical thinking in RBQM.
COVID-19 & the Acceleration of Centralized Monitoring
In the race to develop and test vaccines and treatments that counter the global threat of SARS-CoV-2 quickly and safely, Sponsors have turned to RBQM and centralized monitoring in droves. At CluePoints alone, the number of studies conducted using our RBQM solutions increased by 50% in 2020.
Why a Proactive Approach to Risk Mitigation Matters
RBQM is rooted in a proactive philosophy: identify, assess, monitor, and mitigate risks that may impact trial quality or patient safety as early as possible. Based on the assumption that site-level data should be broadly comparable, comprehensive statistical analyses are used to detect atypical patterns—whether at the level of sites, patients, countries, or regions. These anomalies are flagged through two key approaches:
- Data Quality Assessments (DQAs): reviewing all trial data to surface inconsistencies.
- Key Risk Indicators (KRIs) and Quality Tolerance Limits (QTLs): monitoring specific, predefined risks.
Any atypical pattern emerges as a risk signal, allowing study teams to investigate and address issues before they jeopardize trial integrity.
Despite strong endorsements from regulators such as the FDA and EMA, implementation practices still vary widely. To unlock the full potential of RBQM, the industry must converge on a consistent standard.
At CluePoints, we believe the foundation for that standard already exists. The answers lie within the data—we simply need to extract them and deliver the insights in a clear, actionable format.
How Metadata Unlocks the Future of RBQM
For the last eight years, our industry-leading RBQM platform has had a front row seat in the sector’s shift to centralized monitoring.
With our clients’ consent, we gathered metadata from KRIs, risk signals, and resulting actions, offering a comprehensive view of RBQM in practice.
As part of our Business Intelligence offering, BEYOND, we’ll share these insights through a new metadata dashboard, allowing users to truly focus on what matters.
Trends in KRIs by Study Phase & Therapeutic Area
The metadata collates anonymized information from almost 57,000 risk signals generated by more than 650 studies across nearly 120 organizations.
Drilling down into the figures, our analysts have found that the average number of KRIs per study over the last eight years was 18.6. Unsurprisingly, this figure varied by study phase, with an average of 15.7 KRIs being monitored per phase one study, compared to 18.8 per phase three. There was also variation by therapeutic area. Cardiovascular studies, for example, had an average of 29 KRIs per study, whereas ophthalmology studies had an average of 12.
Interestingly, we found that the number of KRIs per study had reduced over the last three years (Figure 1). One potential explanation might be the growing experience of monitoring teams in selecting the right targeted indicators to optimize the risk review process by study teams. However, further investigation would be needed to confirm this hypothesis.
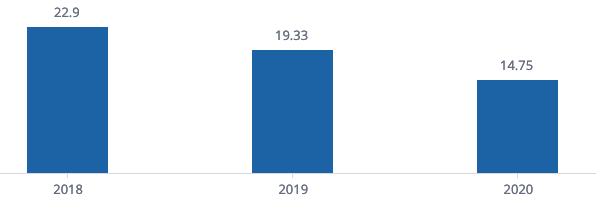
Figure 1. Average Number of KRIs per study in the last 3 years
While almost 100% of clinical trials set at least one KRI analysis by site, fewer than 50% set a KRI analysis at the country level. This is striking, given that 42.21% of country-level signals have, at some point in their lifecycle, entered a watch status, indicating a potential risk to data quality and integrity that warrants ongoing monitoring.
Our analysis found that the three most common KRI categories accounted for nearly 70% of all KRIs in a study’s dashboard.
- Safety ranked first, typically tracking metrics such as non-serious and serious adverse event rates. On average, 3.1 safety-related KRIs were created per study.
- Data Quality was the second most frequent category, encompassing measures such as visit-to-entry cycle time, auto query rate, and query response cycle time. On average, studies included 7.2 data quality KRIs.
- Compliance ranked third, with metrics such as missed assessments, protocol deviations, and off-schedule visit rates. On average, 4.4 compliance KRIs were created per study.
Notably, around one in twelve studies included KRIs related to efficacy measurements (see Figure 2).
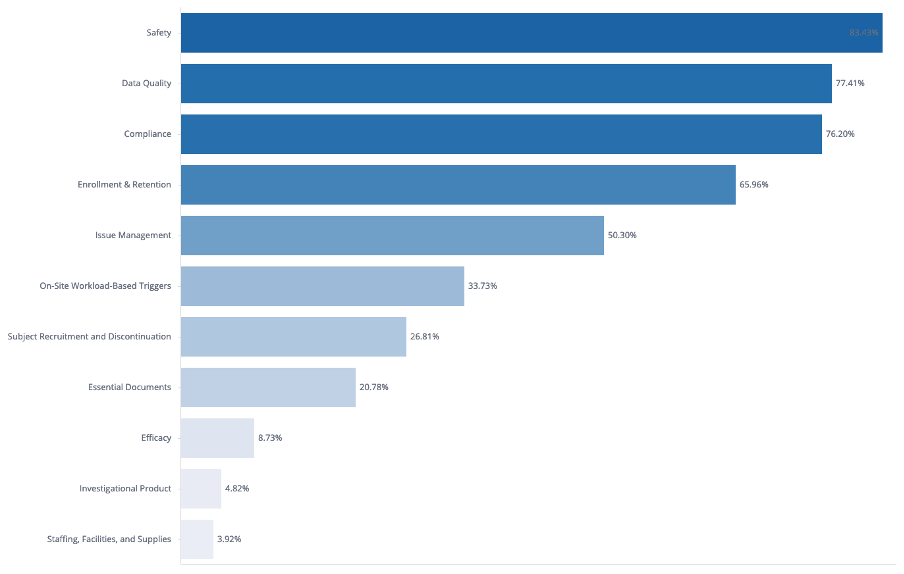
Figure 2. Overall Rate of Studies having at least 1 KRI analysis by KRI Category
While these results underscore the critical role of KRIs in assessing major trial risks, they also reveal a limitation: KRIs provide only a partial view of overall trial quality. To gain a more comprehensive perspective, a broader DQA is needed. Unlike KRIs, which focus on predefined risks within a study, CluePoints’ DQA evaluates the quality of all data collected during a trial, including EDC data as well as sources such as central laboratory data, ePRO, and eCOA. Since 2018, our metadata analysis has shown that 37.5% of all detected anomalies (over 21,000 signals) were triggered by a full DQA.
Informing the Future of RBQM Standards
Usage Dashboards are part of BEYOND, enabling Sponsors and CROs to monitor their entire study portfolio and generate key usage metrics—such as the average number of KRIs per study, signal mitigation history, and the percentage of signals currently in Watch or Alert status. By leveraging these insights, organizations can ensure that study teams remain compliant while driving greater standardization across protocols and portfolios.
Creating a Holistic View of Risk Across Therapeutic Areas
To provide users with a broader perspective on platform performance, CluePoints integrated cross-organization benchmark data into each organization’s Usage Dashboard. This allows clients, for example, to compare their signal-to-issue resolution time against benchmarks aggregated across all organizations and trials on the platform. They can also assess whether their number of critical signals or alerts—either within a single study, across a portfolio, or within a therapeutic area—sits above or below the industry average.
But it doesn’t stop with KRIs, signals, and actions. The Usage Dashboard has opened the door to far greater possibilities. While the team has so far focused on these key areas, there remains a wealth of additional insights yet to be uncovered.
Our next step in this development is to analyze the risk assessment (RACT) metadata we hold to unlock insights into critical processes, critical data risks, and risk mitigation.
The resulting dashboard, which we hope to release later this year, will enable our clients to understand if there are studies or therapeutic areas that have intrinsically higher risk scores than others.
The goal is to offer a collection of Usage Dashboards that present a holistic, rather than a study-by-study, view of how RBQM is taking shape on the ground.
Shaping the Future of Clinical Trial Quality
By enabling sector-wide comparisons, CluePoints aims to deliver Business Intelligence that guides individual company strategy and informs industry-wide best practices, ultimately contributing to creating a gold standard framework for risk-based and centralized monitoring. Contact CluePoints to discuss.