AUTHOR: SYLVIANE DE VIRON, MANAGER, DATA & KNOWLEDGE, CLUEPOINTS AND WILLIAM STEIJN, RESEARCH DATA ANALYST, CLUEPOINTS
Central Monitoring is a key component of Risk-Based Quality Management (RBQM). Many organizations have now implemented it to enable and support pro-active quality oversight of clinical research. Central monitoring aims to detect emerging quality issues pro-actively during a clinical study, resulting in study team intervention to address the issues to drive optimal quality outcomes. Many practitioners of central monitoring have become convinced of its effectiveness in driving higher quality, but until now, there has been little in the way of objective evidence. So, an important question has remained for the industry: Does central monitoring result in improved quality?
CluePoints has conducted the first phase of analysis to assess this very question, leveraging central monitoring data compiled from many hundreds of studies across numerous organizations. For this first analysis, we selected several commonly used KRIs to assess their impact on addressing specific quality behaviors of interest at clinical study sites.
The first KRI to be analyzed was “Visit-to-eCRF Entry Cycle Time” (V2ECT), which identifies sites that are delayed in reporting patient visit data into the study EDC system. This is recognized as an important quality-related site behavior for several reasons. Perhaps most importantly, long delays in data delivery confound the study team’s ability to detect emerging issues centrally. Sites whose average Visit-to-eCRF Entry Cycle Time (V2ECT) exceed a risk alert threshold will trigger the creation of a risk signal for review and follow-up by members of the study team. A risk signal typically remains open until the study team determines that it is either resolved or no longer applicable (e.g., site or study closure, inability to remediate, etc.).
The evidence associated with each risk signal in CluePoints includes the observed KRI metric value for the site (e.g., V2ECT = 27.4 days), the observed average value across all sites in the study (e.g., 5.2 days), and a statistical score representing a p-value which indicates how atypical the site’s average cycle time is compared to the study average. Our analysis leveraged this evidence to measure the degree of improvement in each site’s V2ECT performance from risk signal creation until closure. A total of 144 V2ECT KRI signals were selected from the database using the following criteria:
- The V2ECT KRI implemented for the study used the standard CluePoints definition.
- The KRI statistical score was greater than 1.3 (i.e., p-value < 0.05, meaning that there is less than a 5% chance that the site average is similar to the average across all study sites) when the signal was initially created.
- The risk signal has been subsequently closed.
The signals selected for this analysis are those which alerted the study team to sites taking an unusually long time to report their patient eCRF data, resulting in a follow-up discussion with the site personnel, usually by the responsible site monitor (CRA).
Our analysis found that the statistical score improved in 97.2% of the signals (140 out of 144). Thus, the site’s average V2ECT became statistically less atypical compared to the study average in almost every instance. Additionally, the site’s observed average V2ECT moved closer to the study average in 89.9% of the signals.
We also found that, on average, the sites’ V2ECT moved 85.5% closer to the expected behavior (study average). For example, if a site’s average entry cycle time was initially 20 days longer than expected, and upon signal closure was only 4 days longer than expected, the site improved by 80% (16/20).
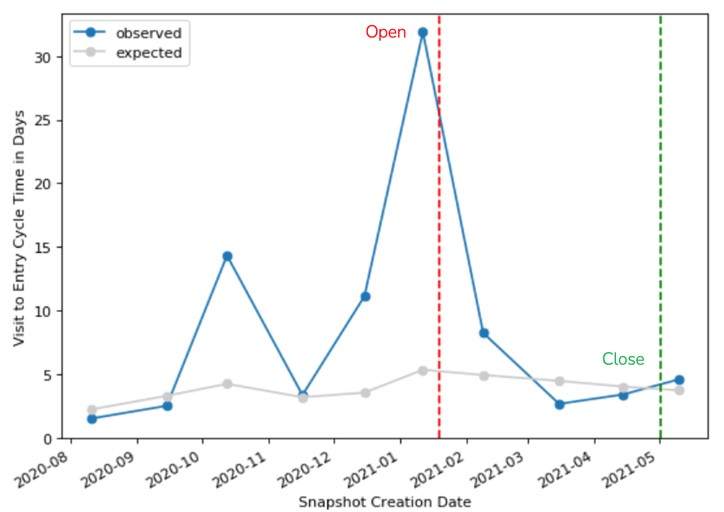
Figure 1 shows the observed (site average) and expected (study average) V2ECT for one of the signals included in our analysis. The signal was created after the site was observed with a significantly high V2ECT of 32 days compared to the study average of 5 days. The CRA followed up with the site to discuss their observed delay in data entry, and subsequently there was a significant improvement in their data entry timeliness. The signal was kept open by the study team for several months to confirm ongoing compliance. At the time of closure, the site’s average V2ECT (4 days) was slightly better than the study average – an improvement of greater than 100%.
Figure 1. V2ECT signal example.
The same analysis was conducted for several more commonly used KRIs, and the results are similarly very positive. For example, 89.7% of signals for the Missed Assessment Rate KRI showed improvement, along with 76.5% of signals for the Adverse Event Reporting Rate KRI. The improvement observed for the AE reporting rate is particularly impressive. In a strong majority of the follow-up interventions with sites, CRAs could not confirm any issues in the site’s AE collection and reporting process. This is compelling evidence that discussion with the site raises their awareness and leads to improved AE reporting compliance even while they most often fail to acknowledge any prior delinquency.
These results provide clear evidence for what we have long suspected: Central monitoring works! When properly implemented and managed, KRIs enable a much more targeted, efficient approach to identifying and addressing emerging quality risks during a study, leading to improved quality.


