
Key Risk Indicators (KRIs)
1
Site Performance
Obtain a prioritized view of your sites based on their performance.
2
Site Performance
See site performance based on your thresholds and relatively against other sites.
3
Review Trends
Review KRI trends and evaluate effectiveness of your corrective actions.
Hover over the toggles to discover the features.
UNCOVER SITES 'AT RISK'
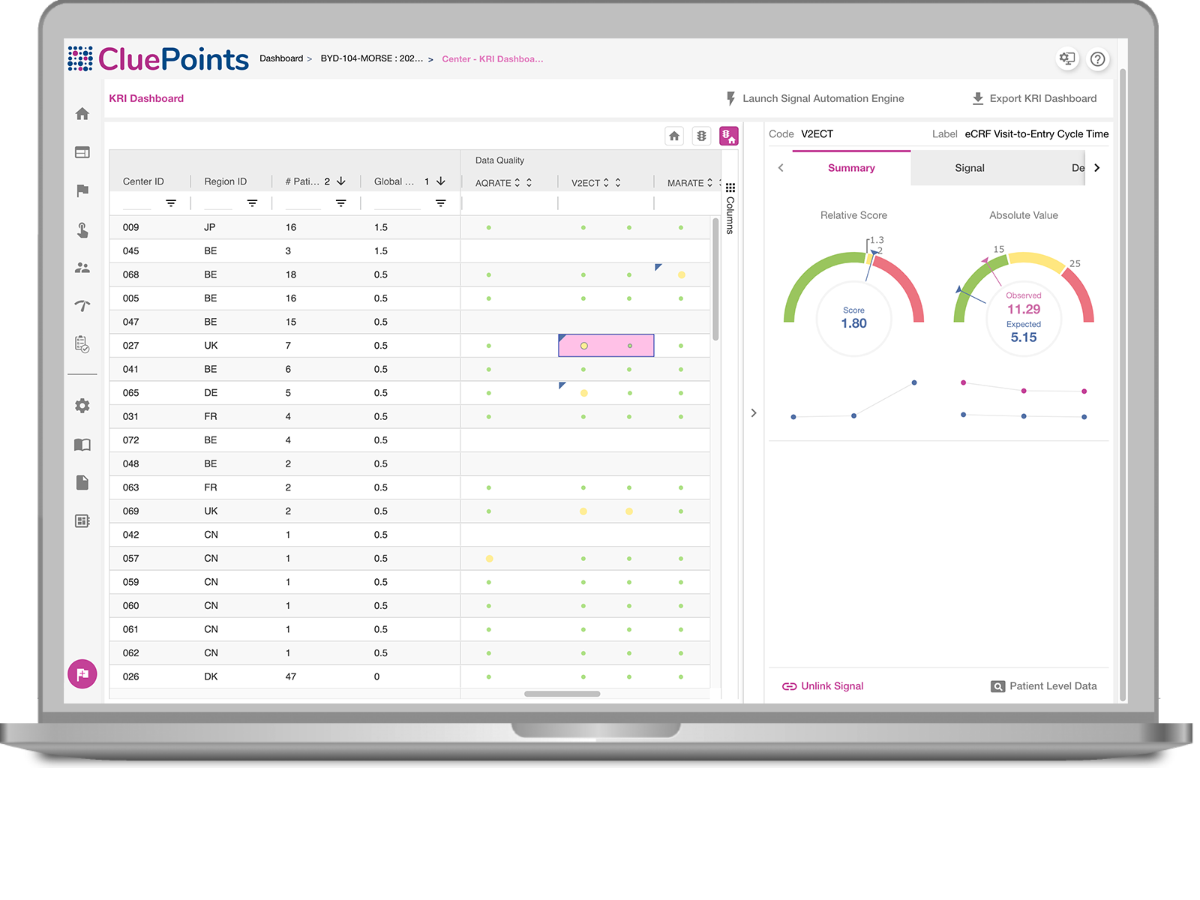
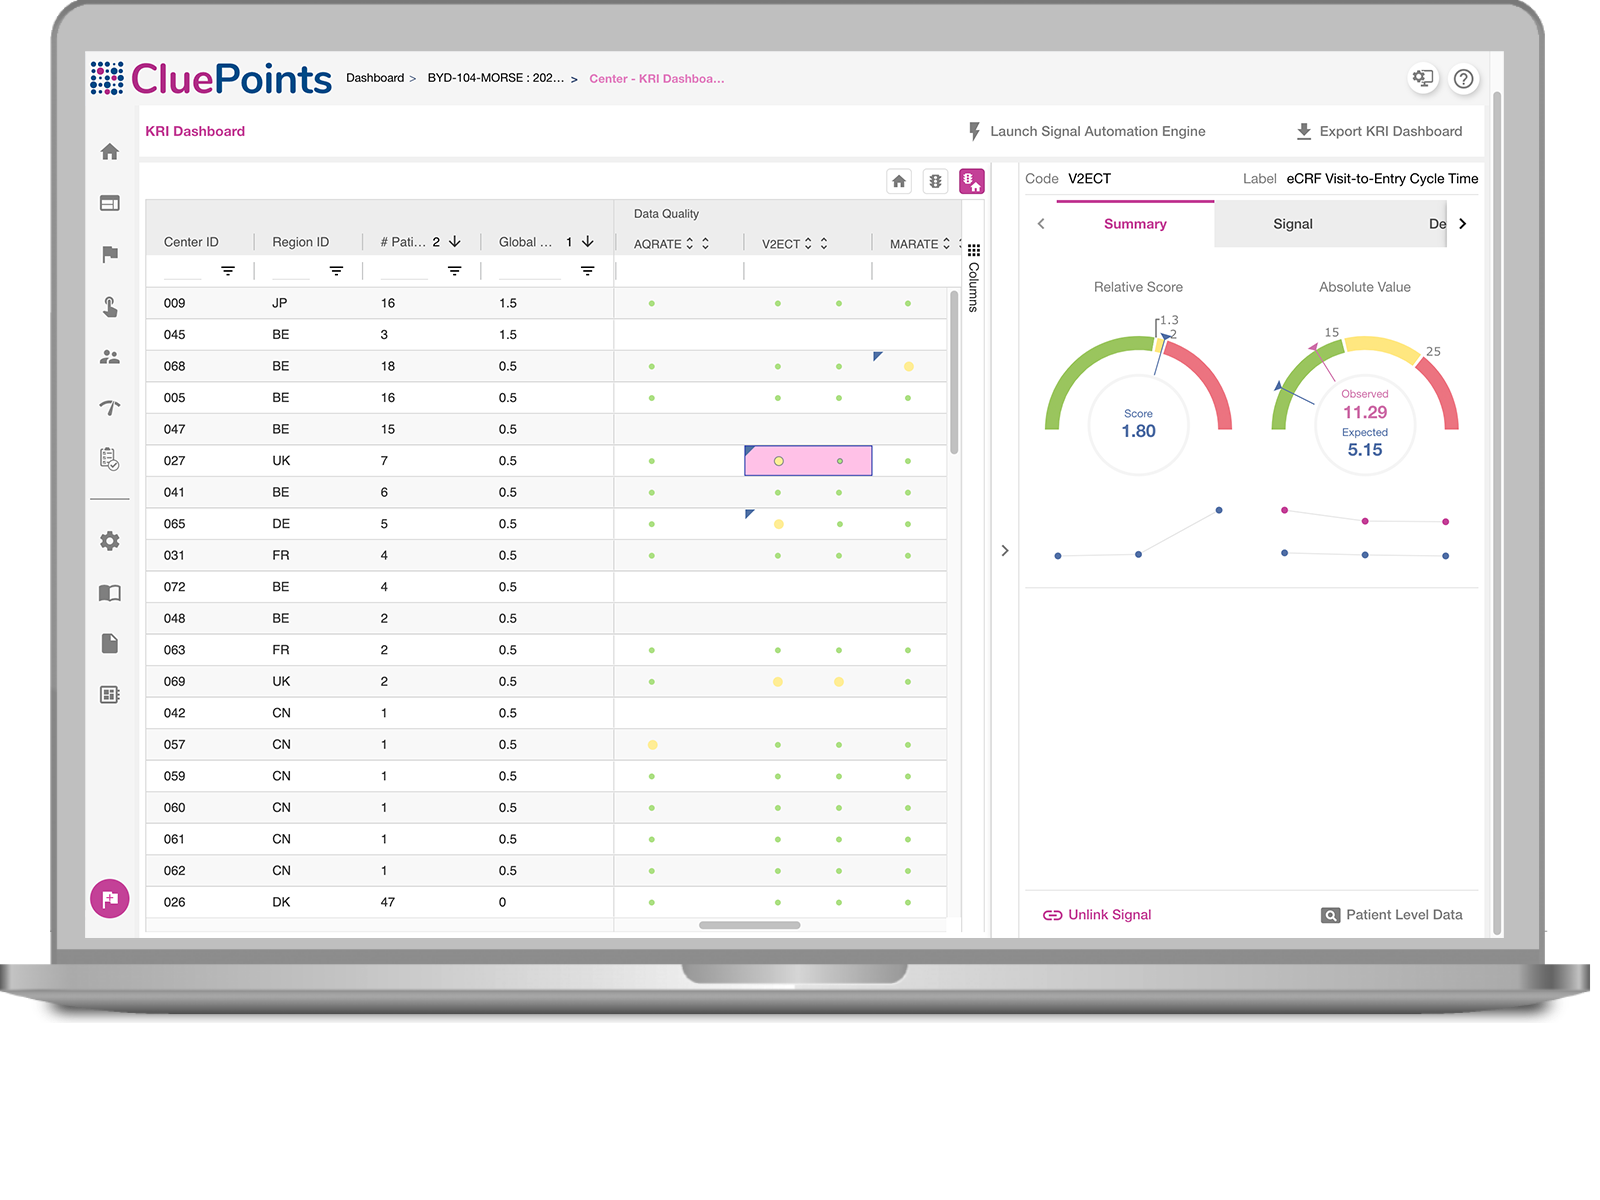
CluePoints’ KRI Dashboard harnesses the power of statistical algorithms to provide a convenient way to monitor how sites are performing versus the metrics that are important to the trial. Sites are ranked and prioritized by those with most performance issues, thus illuminating the sites that are ‘at risk’.
1
Site Performance
Obtain a prioritized view of your sites based on their performance.
2
Site Performance
See site performance based on your thresholds and relatively against other sites.
3
Review Trends
Review KRI trends and evaluate effectiveness of your corrective actions.
Hover over the toggles to discover the features.
- Key Risk Indicators offer a prioritized, risk-based approach to monitoring trials, as advocated by the FDA and ICH.
- Provides users with the power of an objective statistical analysis as well as subjective thresholds to trigger actions across key variables.
- Choose from a pre-defined set of KRIs, or add KRIs specific to your own data points.
- Each KRI comes with two results: Relative Score (how site is performing against peers) and Absolute Score( how site is performing against Tolerance Limits).
- Drill down into patient data to interrogate the cause and effect, and select the relevant Patient Profiles to further interrogate the results.
- Flag all potential issues and ensure successful corrective action using the inherent Issue Tracking Management System.
Just a few examples of the Key Risk Indicators some of our clients are using in their studies:
- Non-Serious Adverse Events Rate:
Rate of non-serious adverse events per patient visit. - Serious Adverse Event Rate:
Rate of serious adverse events per patient visit. - Missed Assessment Rate:
Proportion of expected patient assessments that were not conducted; i.e., “missed” (for identified assessments of interest) - Protocol Deviation Rate:
Rate of protocol deviations per patient visit - Off Schedule Visit Rate:
Rate of patient visits conducted outside of allowable schedule - eCRF Visit-to-Entry Cycle Time:
Average cycle time from patient visit to eCRF entry - Auto-Query Rate:
Rate of auto-queries generated per datapoint submitted - Query Response Cycle Time:
Average cycle time from query generation to query response - Screen Failure Rate:
Proportion of screen-failed patients to total screened patients - Early Termination Rate:
Rate of early-terminated patients per patient visit
Got a Question?
Whether you’re looking to get started or need support, we’re here to help!
Featured Resource
Tufts CSDD Impact Report
This study takes a proactive approach to understanding the dynamics between the enthusiasm around and adoption of RBQM, designed to enhance clinical trial quality and efficiency.
Featured Webinar
RBQM Adoption & ICH E6(R3) Updates
This recorded webinar dissects the Tufts CSDD Impact Report as well as new clinical trial execution models and ICH E6(R3) regulatory guidance updates.
We're Kind of a Big Deal.
7,000
Platform Users
1,200
Studies De-Risked
100,000
Issues Detected